- I Tried Both: Apple Watch 9 vs Fitbit Charge 6
- Best Places to Print Photos Online

How to Activate the iPhone Debug Console or Web Inspector
Use Safari's web developer tools to study problematic websites
:max_bytes(150000):strip_icc():format(webp)/ScottOrgera-f7aca23cc84a4ea9a3f9e2ebd93bd690.jpg)
- Saint Mary-of-the-Woods College
- Switching from Android
What to Know
- Activate Web Inspector on iOS: Go to Settings > Safari > Advanced and move the Web Inspector toggle switch to the On position.
- Use Web Inspector on macOS: Connect your iOS device to a Mac and choose the URL to inspect from the Develop menu.
If you run into a bug or another issue with a website on Safari mobile, use the Web Inspector tool to investigate. This article explains how to use the Safari console for iPhone to debug errors with the help of your Mac computer. Instructions apply to iPhones with iOS 14, iOS 12, or iOS 11, and well as Macs with macOS Big Sur (11.0), macOS Catalina (10.15), or macOS Mojave (10.14).
Activate Web Inspector on Your iPhone or Other iOS Device
The Web Inspector is disabled by default since most iPhone users have no use for it. However, if you're a developer or you're curious, you can activate it in a few short steps. Here's how:
Open the iPhone Settings menu.
On an iPhone with an early version of iOS, access the Debug Console through Settings > Safari > Developer > Debug Console . When Safari on the iPhone detects CSS, HTML, and JavaScript errors, details of each display in the debugger.
Scroll down and tap Safari to open the screen that contains everything related to the Safari web browser on your iPhone, iPad, or iPod touch.
Scroll to the bottom of the page and select Advanced .
Move the Web Inspector toggle switch to the On position.
Connect Your iOS Device to Safari on a Mac
To use the Web Inspector, connect your iPhone or another iOS device to a Mac that has the Safari web browser and enable the Develop menu .
With Safari open, select Safari from the menu bar and choose Preferences .
Select the Advanced tab.
Select the Show Develop menu in menu bar check box and close the settings window.
From the Safari menu bar, select Develop and choose the name of your attached iOS device, then select the URL that appears under Safari to open the debug console for that site.
After you connect your device, use your Mac to inspect the website you want to debug and have it open in the Safari mobile browser.
What Is Web Inspector?
Web developers use Web Inspector to modify, debug, and optimize websites on Macs and iOS devices. With Web Inspector open, developers can inspect the resources on a web page. The Web Inspector window contains editable HTML and notes regarding the styles and layers of the web page in a separate panel.
Before iOS 6, the iPhone Safari web browser had a built-in Debug Console that developers used to find web page defects. Recent versions of iOS use Web Inspector instead.
With Safari 9 and OS X Mavericks (10.9), Apple introduced Responsive Design Mode in Web Inspector. Developers use this built-in simulator to preview how web pages scale to different screen sizes, resolutions, and orientations.
To set up Web Inspector on your iPad, open your iPad's Settings and select Safari > Advanced , then turn Web Inspector On . Connect the iPad to a Mac computer, then open Safari on the Mac and select Safari > Preferences > Advanced , then turn on Show Develop menu in menu bar .
You cannot just connect your iPhone to a Windows PC and start using Web Inspector through Chrome like you can with a Mac. Installing package manager software can provide you a sort of workaround, but it's not recommended unless you're familiar with the package management app you intend to use.
Get the Latest Tech News Delivered Every Day
- Add More Features by Turning on Safari's Develop Menu
- 4 Ways to Play Fortnite on iPhone
- How to Activate and Use Responsive Design Mode in Safari
- How to Change the Default Search Engine in Chrome for iOS
- What Is Safari?
- How to Inspect an Element on a Mac
- How to Use Web Browser Developer Tools
- How to Disable JavaScript in Safari for iPhone
- How to Clear Search History on iPhone
- 10 Hidden Features in macOS Sonoma
- How to View HTML Source in Safari
- How to Manage History and Browsing Data on iPhone
- How to Change Your Homepage in Safari
- How to Manage Cookies in the Safari Browser
- How to Reset Safari to Default Settings
- How to Clear Private Data, Caches, and Cookies on Mac
- PRO Courses Guides New Tech Help Pro Expert Videos About wikiHow Pro Upgrade Sign In
- EDIT Edit this Article
- EXPLORE Tech Help Pro About Us Random Article Quizzes Request a New Article Community Dashboard This Or That Game Popular Categories Arts and Entertainment Artwork Books Movies Computers and Electronics Computers Phone Skills Technology Hacks Health Men's Health Mental Health Women's Health Relationships Dating Love Relationship Issues Hobbies and Crafts Crafts Drawing Games Education & Communication Communication Skills Personal Development Studying Personal Care and Style Fashion Hair Care Personal Hygiene Youth Personal Care School Stuff Dating All Categories Arts and Entertainment Finance and Business Home and Garden Relationship Quizzes Cars & Other Vehicles Food and Entertaining Personal Care and Style Sports and Fitness Computers and Electronics Health Pets and Animals Travel Education & Communication Hobbies and Crafts Philosophy and Religion Work World Family Life Holidays and Traditions Relationships Youth
- Browse Articles
- Learn Something New
- Quizzes Hot
- This Or That Game
- Train Your Brain
- Explore More
- Support wikiHow
- About wikiHow
- Log in / Sign up
- Computers and Electronics
- File Manipulation
4 Easy Ways to Inspect Element on an iPhone
Last Updated: August 8, 2023 Fact Checked
- Safari Developer Tools
- Web Inspector
- JavaScript Bookmark
- Edit Webpage Shortcut
This article was written by Luigi Oppido and by wikiHow staff writer, Nicole Levine, MFA . Luigi Oppido is the Owner and Operator of Pleasure Point Computers in Santa Cruz, California. Luigi has over 25 years of experience in general computer repair, data recovery, virus removal, and upgrades. He is also the host of the Computer Man Show! broadcasted on KSQD covering central California for over two years. This article has been fact-checked, ensuring the accuracy of any cited facts and confirming the authority of its sources. This article has been viewed 41,453 times.
Need to debug a website on your iPhone but can't find "Inspect Element?" While this common browser feature isn't built into Safari on your iPhone, there are still ways you can inspect website elements without paying for an app. The official way is to use Safari Developer Tools, which requires you to connect your iPhone to a Mac. If you're not near a computer, you can install a free app called Web Inspector, or create a JavaScript bookmark (which also works on Chrome). Or, if you're not debugging a web app and just want to change the way a website looks, you can use an iPhone shortcut called Edit Webpage.
Things You Should Know
- Use Safari Developer Tools to inspect elements by connecting your iPhone to your Mac.
- To inspect an element without a computer, install the Web Inspector app, or use a JavaScript bookmark.
- To edit text or remove images from a website, try the Edit Webpage shortcut in the Shortcuts app.
Using Safari Developer Tools

- You will need to use a USB cable to connect , as connecting with Wi-Fi won't allow you to inspect an element.

- Open your iPhone's Settings .
- Scroll down and tap Safari .
- Scroll down and tap Advanced .
- Tap the "Web Inspector" switch to turn it on (green).

- Click the Safari menu.
- Click Settings .
- Click Advanced .
- Select "Show Develop menu in menu bar." [1] X Research source

- As you select items in the Elements tab on your Mac, you'll see the selected element highlighted on your iPhone. [2] X Research source
- If you want to continue using Inspect Element without leaving your iPhone plugged in to your Mac, click the Develop menu again and select Connect via Network .
Using the Web Inspector Extension

- Web Inspector is useful for inspecting elements in Safari as it doesn't require you to connect your iPhone to a Mac. If you want to debug in Chrome, you'll need to use a JavaScript bookmark instead.
- While this extension does have the same name as Safari's "Web Inspector," it's not an official Apple tool.

- Open Safari and go to any website.
- Tap Aa in the address bar.
- Tap Manage Extensions . [3] X Research source
- Tap the switch next to "Web Inspector" to enable it.

- To allow Web Inspector to inspect elements on this website for one day only, select Allow for One Day .
- If you choose the latter option, you won't have to give Web Inspector permission to access websites again in the future.

- When you're finished, double-tap Aa to close Web Inspector.
Using a JavaScript Bookmark

- 1 Go to the website you want to inspect. This trick involves creating a bookmark that contains a string of JavaScript code to bring Inspect Element to any iPhone web browser. This trick will work in both Safari and Chrome, though the process of creating the bookmark will be a little different.

- Chrome: Tap the three-dot menu and select Add to Bookmarks .
- Safari: Tap the Sharing icon at the bottom, then tap Add to Favorites .

- Chrome: Tap the three-dot menu and select Bookmarks at the top. Tap and hold the new bookmark, then tap Edit Bookmark.
- Safari: Tap the open book icon at the bottom, then tap Favorites . Tap and hold the bookmark you just created, then tap Edit .

Using the Edit Webpage Shortcut

- You'll find the Shortcuts app in your App Library.
- This is helpful if you want to edit text or remove images and other objects from a website you're viewing.

- Scroll down and tap Shortcuts .
- Tap Advanced .
- Toggle on "Allow Running Scripts."

- Tap any element to edit it. Now you can edit text and images on the website without having an official Inspect Element feature built into Safari.
Expert Q&A
- Adobe Edge Inspect was a popular tool for inspecting elements on websites, but the tool is no longer in development or receiving updates. [4] X Research source Thanks Helpful 1 Not Helpful 0
- There are also several paid apps that will allow you to inspect web elements on your iPhone, including Achoo HTML Viewer & Inspector and Inspect Browser. Thanks Helpful 2 Not Helpful 0

You Might Also Like

- ↑ https://support.apple.com/guide/safari/use-the-developer-tools-in-the-develop-menu-sfri20948/mac
- ↑ https://support.apple.com/guide/safari-developer/inspecting-overview-dev1a8227029/mac
- ↑ https://support.apple.com/guide/iphone/get-extensions-iphab0432bf6/ios
- ↑ https://helpx.adobe.com/edge-inspect/system-requirements.html
About This Article

- Send fan mail to authors
Is this article up to date?

Featured Articles

Trending Articles

Watch Articles

- Terms of Use
- Privacy Policy
- Do Not Sell or Share My Info
- Not Selling Info
wikiHow Tech Help Pro:
Level up your tech skills and stay ahead of the curve
How to use Safari Web Inspector on Mac, iPad, and iPhone
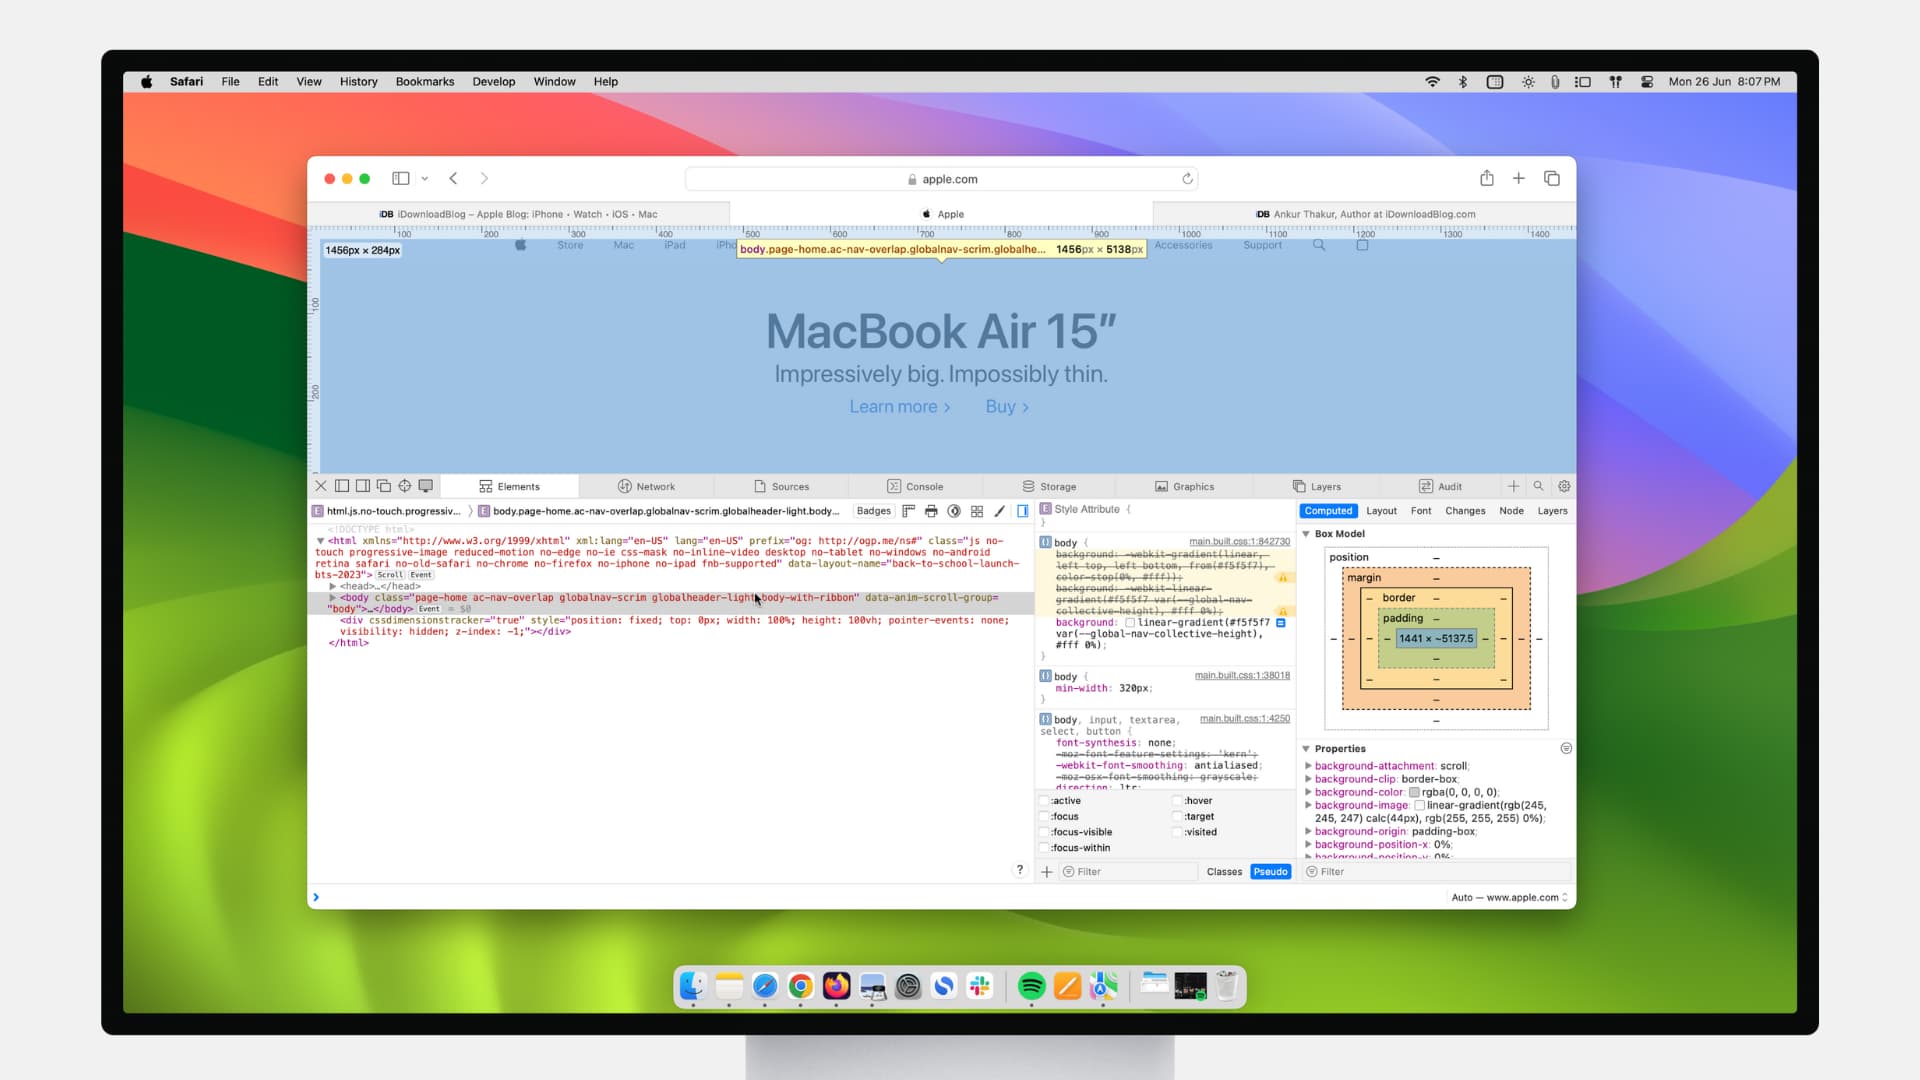
If you’re a web developer, then you likely already know about Safari’s Web Inspector. But if you’re just starting to use Safari for development or have just begun your Web Development career, this guide will show you the basics for getting started with the Safari Web Inspector on iOS and Mac.
What is the Safari Web Inspector?
For those not yet familiar with the tool, you can use the Safari Web Inspector for help with your web development. It allows you to review page elements, make changes, troubleshoot problems, and review page performance. Apple sums it up with:
Web Inspector is the primary web development tool in Safari. Web Inspector allows you to inspect, tweak, debug, and analyze the performance of your web content in a Safari tab.
Enable and open Safari Web Inspector
You can use the Safari Web Inspector for development on your iPhone, iPad, or Mac. Here’s how to enable and open it on iOS and macOS so you’re ready to use it when you need it.
If you’re going to use the Web Inspector frequently, whether for iOS or Mac, you might as well add the Develop tab to your menu bar so you can access it easily.
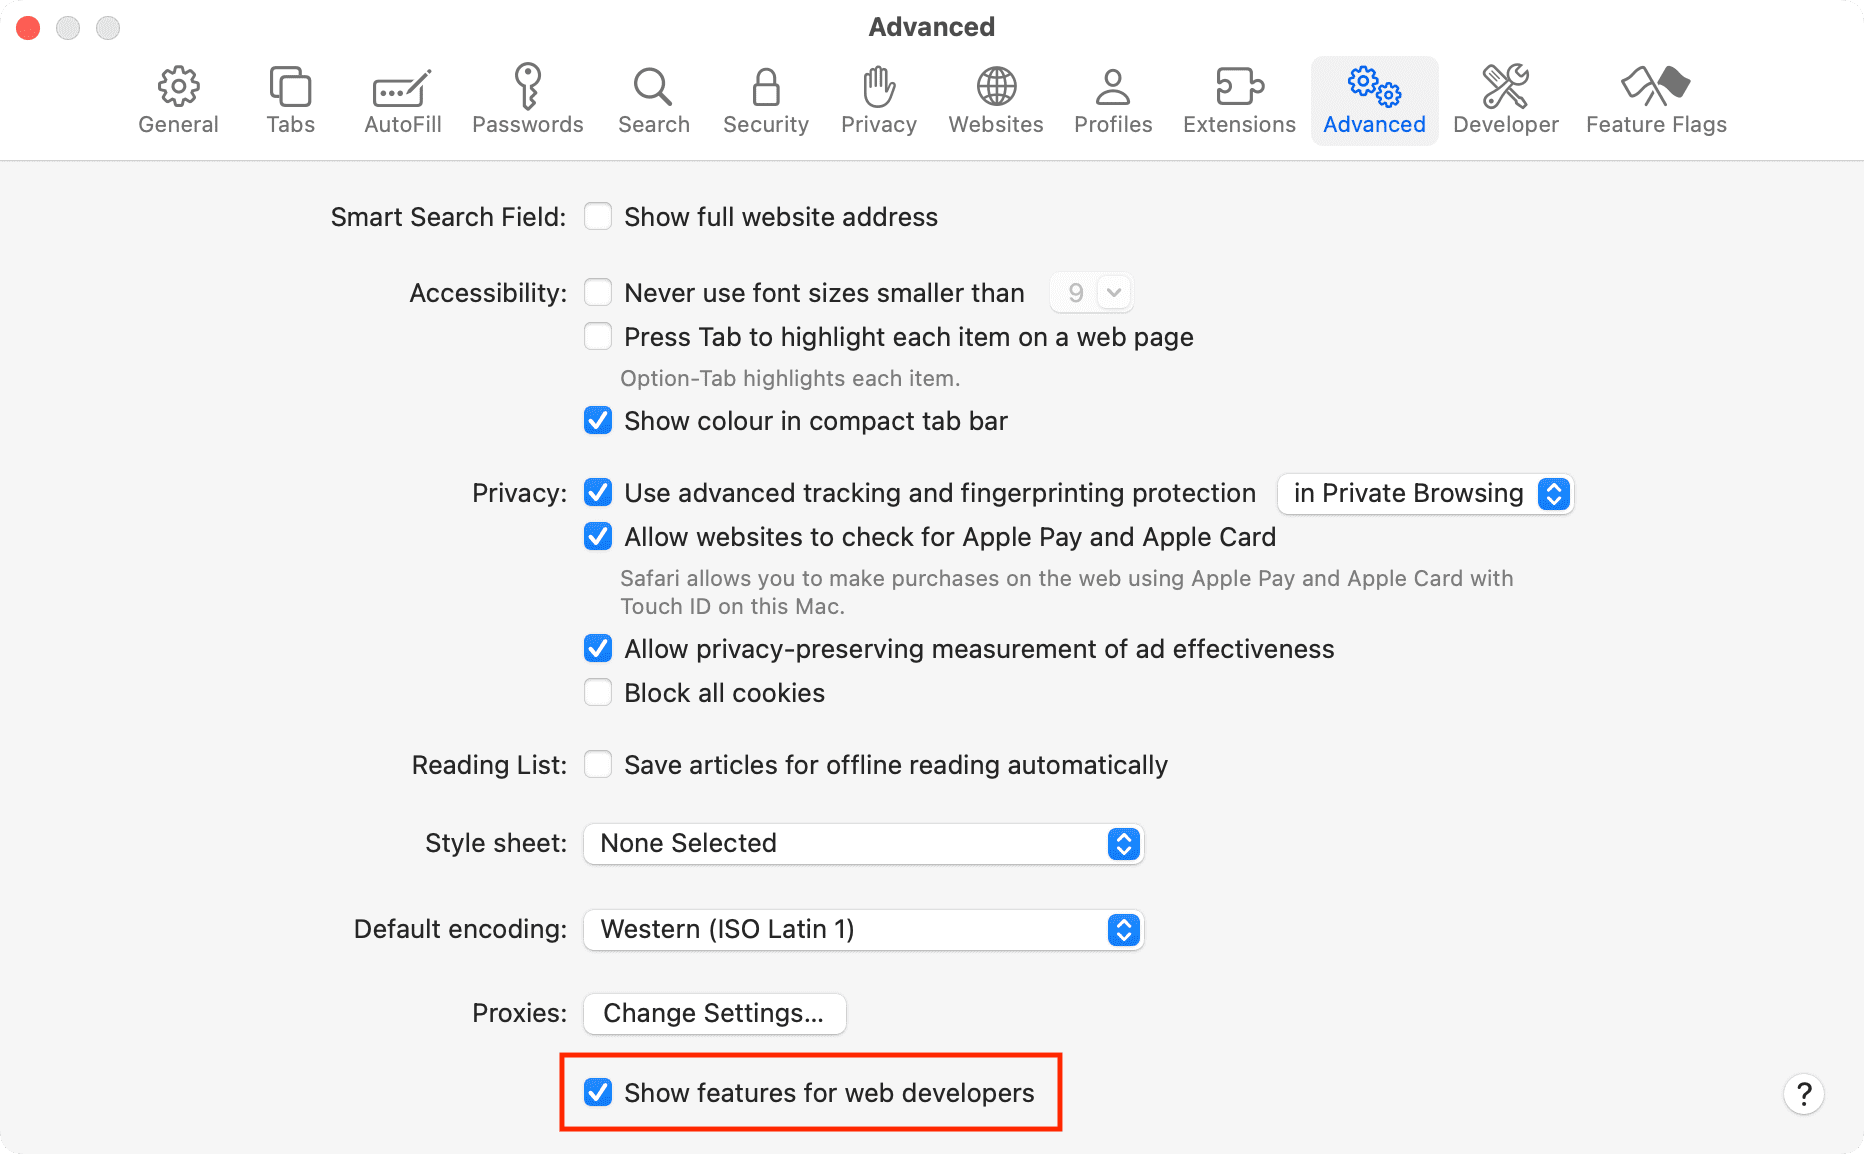
- Open Safari on your computer and click Safari > Settings or Preferences from the menu bar.
- Choose the Advanced tab.
- Check the box at the bottom for “ Show features for web developers ” or Show Develop menu in menu bar .
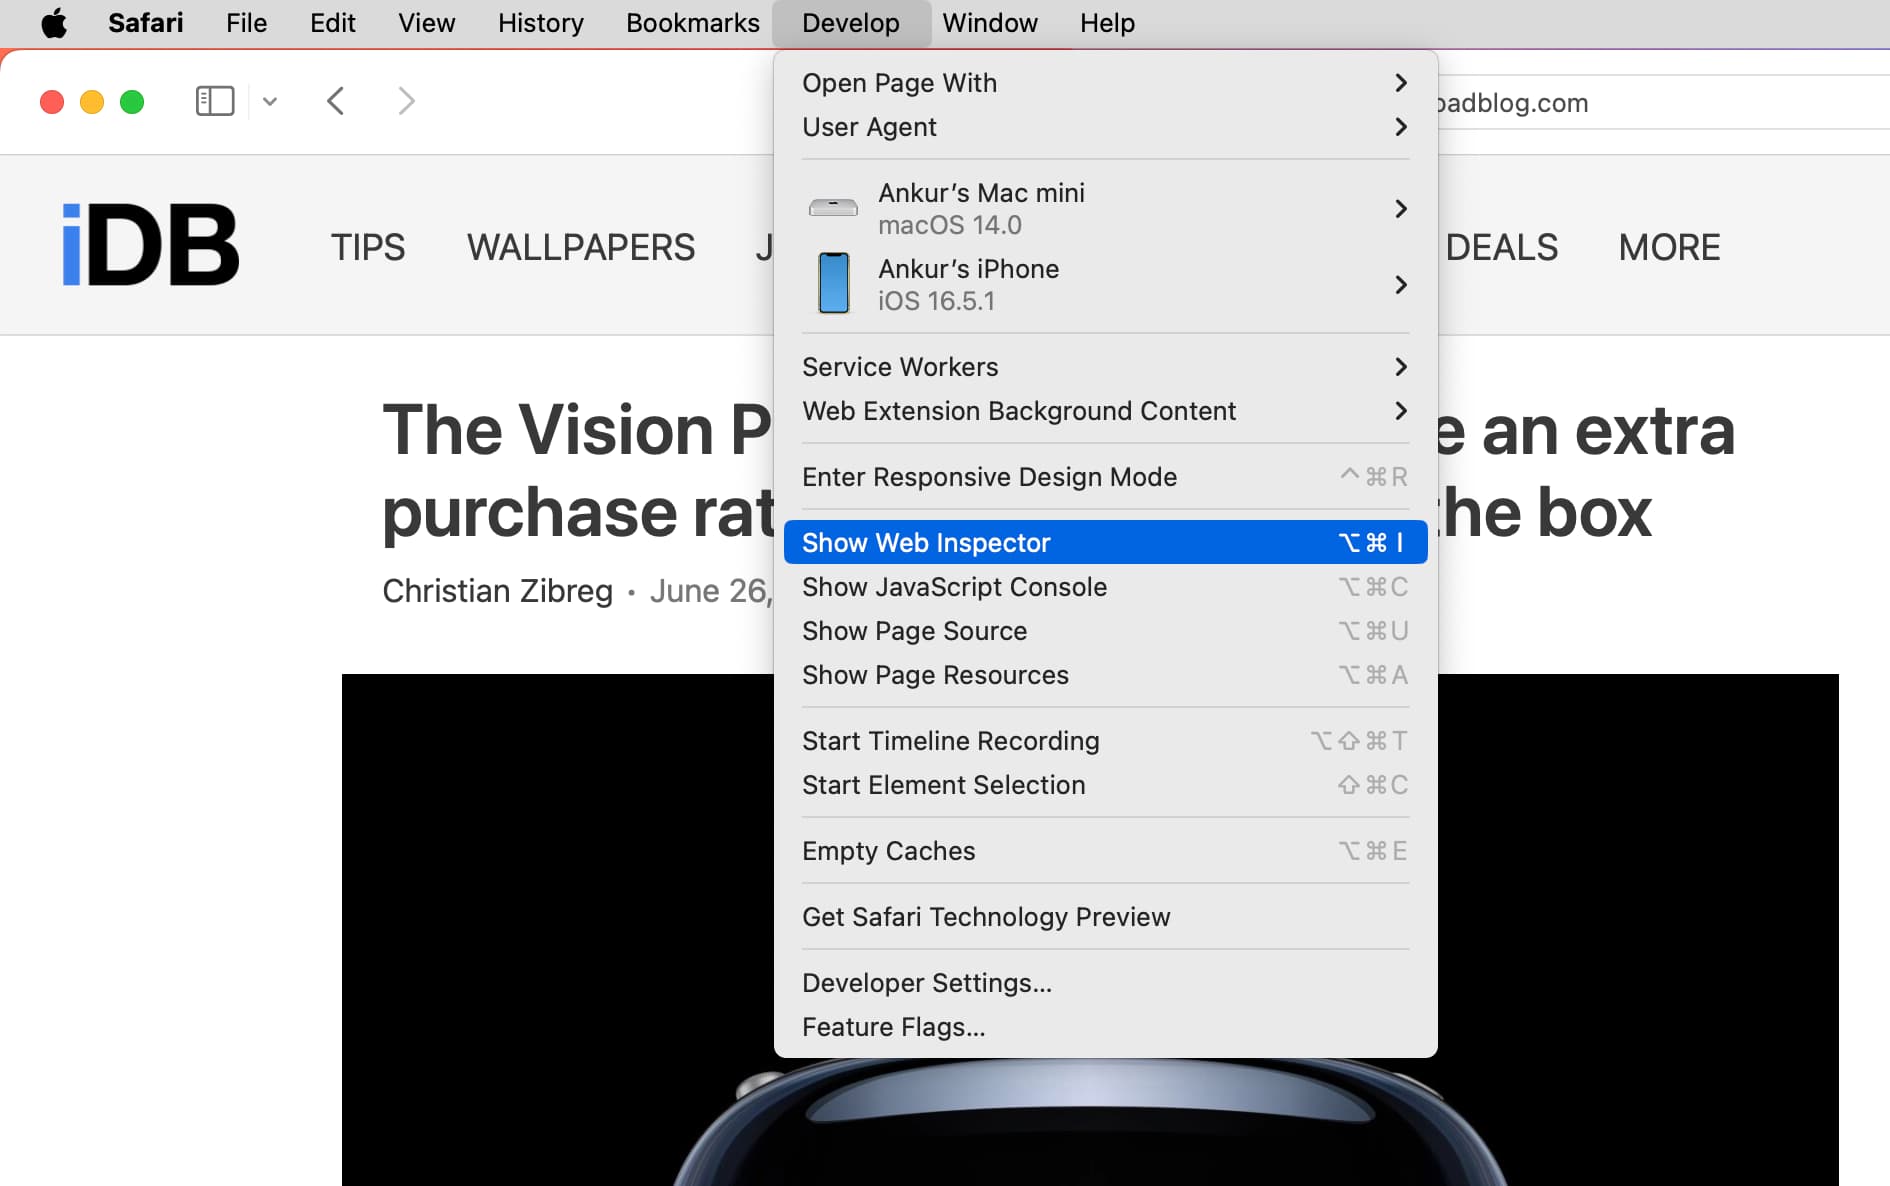
Now when you want to enable the Web Inspector, click Develop > Show Web Inspector from your menu bar.
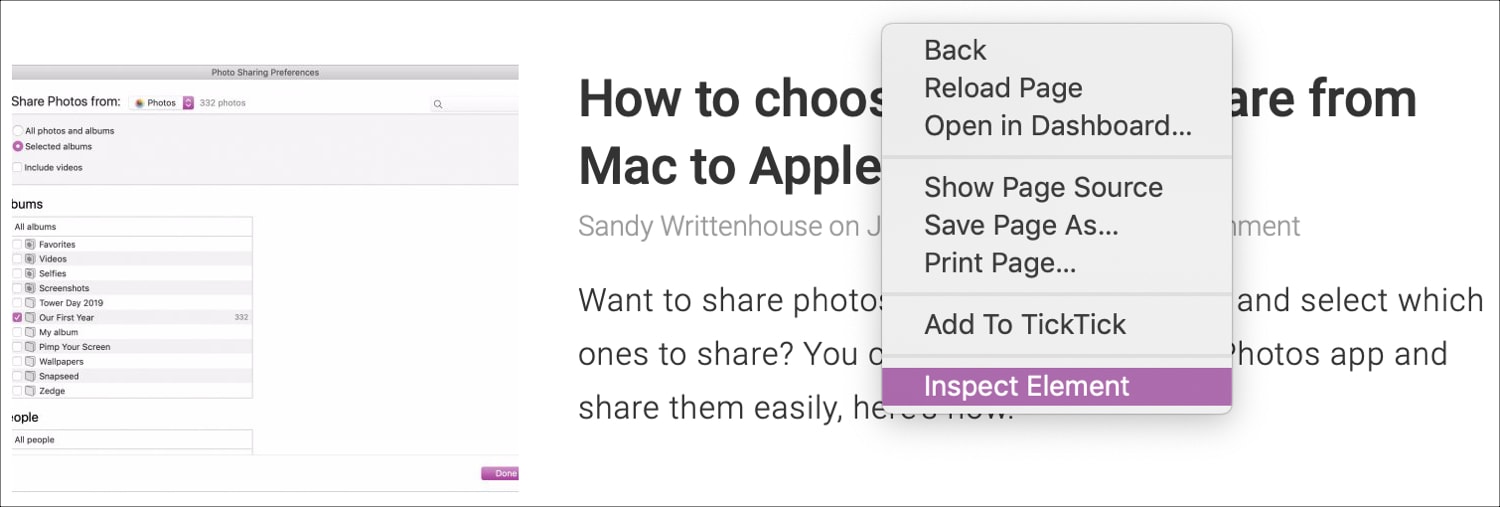
If you prefer to forgo adding the Develop button to your menu bar, you can access the Web Inspector on Mac with a shortcut. Navigate to the page you want to inspect, right-click on it, and pick Inspect Element from the context menu.
Just keep in mind that if you plan to use Web Inspector for Safari on your iOS device, you’ll need the Develop button in the menu bar on your Mac.
For iPhone and iPad
To use the Web Inspector for iOS on your Mac, grab your USB cable and connect your iPhone or iPad to your computer. Then, follow these steps to enable the tool:
- Open the Settings app on your iPhone or iPad and tap Safari .
- Scroll to the bottom and tap Advanced .
- Enable the toggle for Web Inspector .
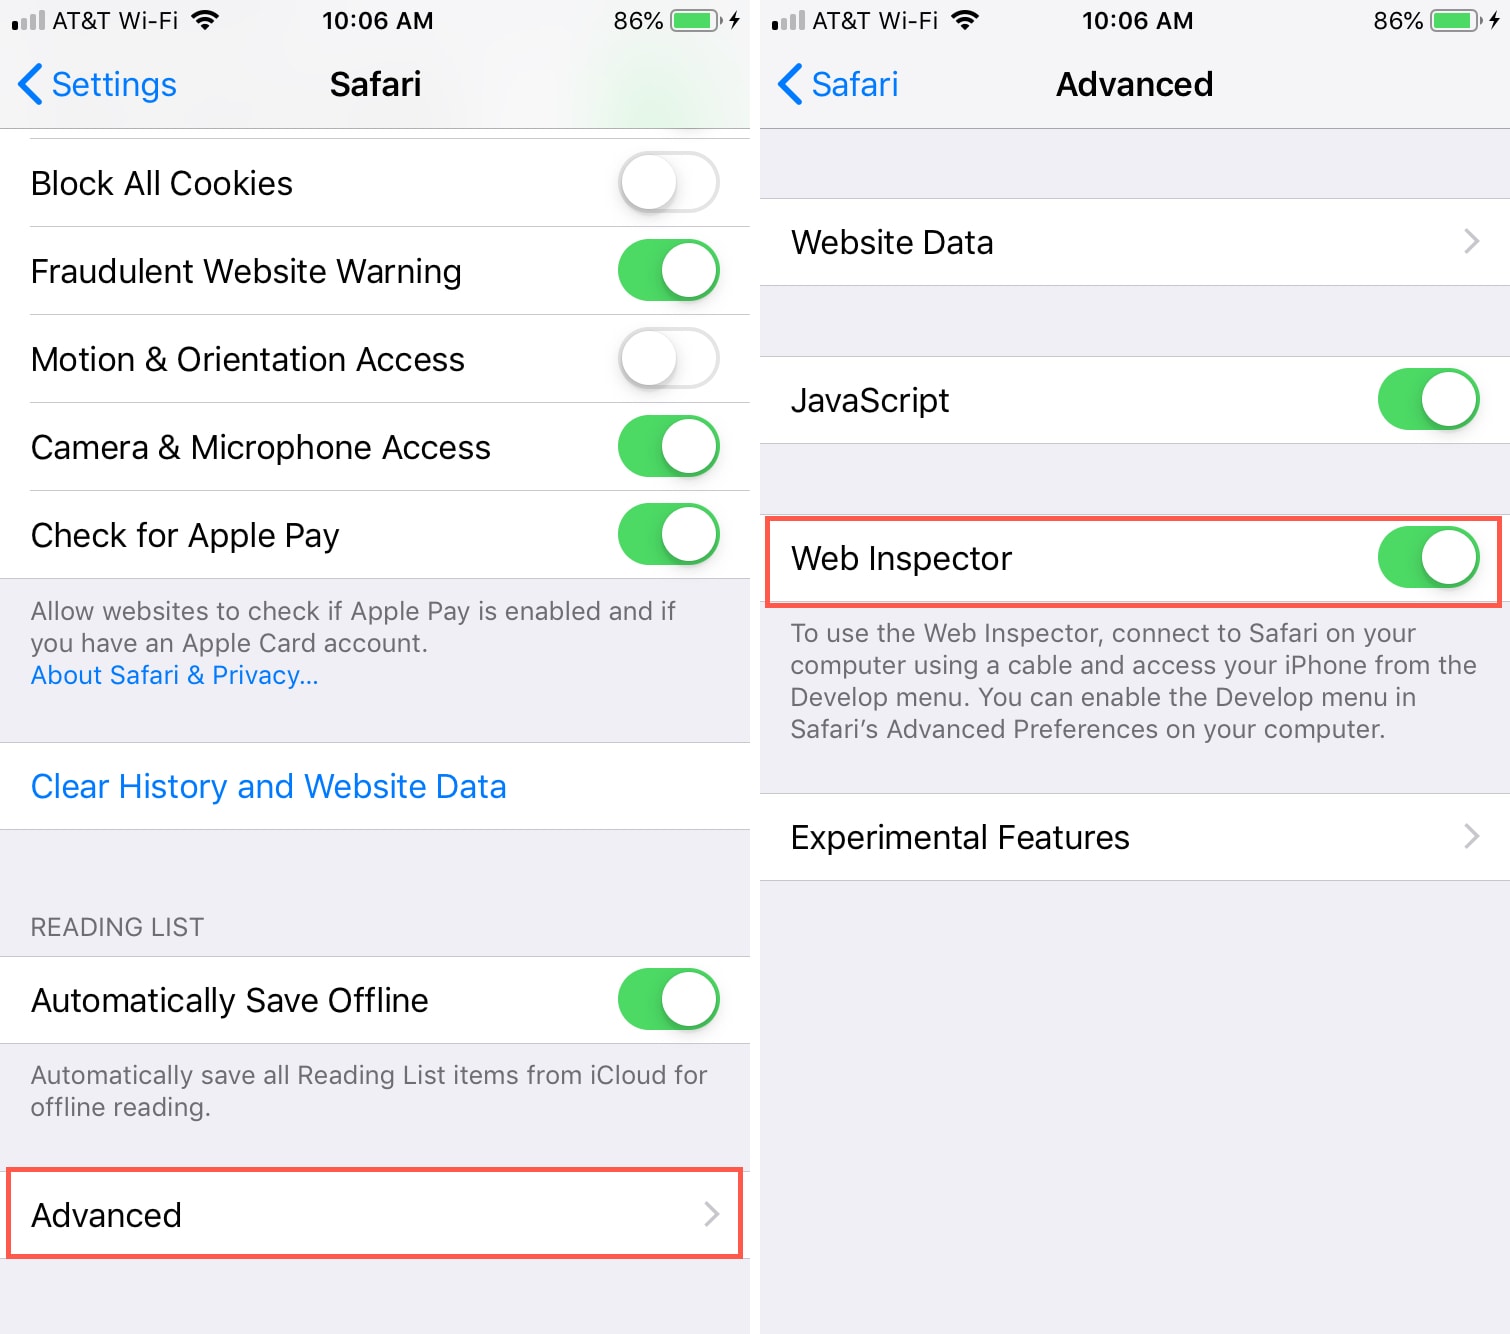
Next, make sure Safari is open on your iOS device and your Mac. After that, follow these steps:
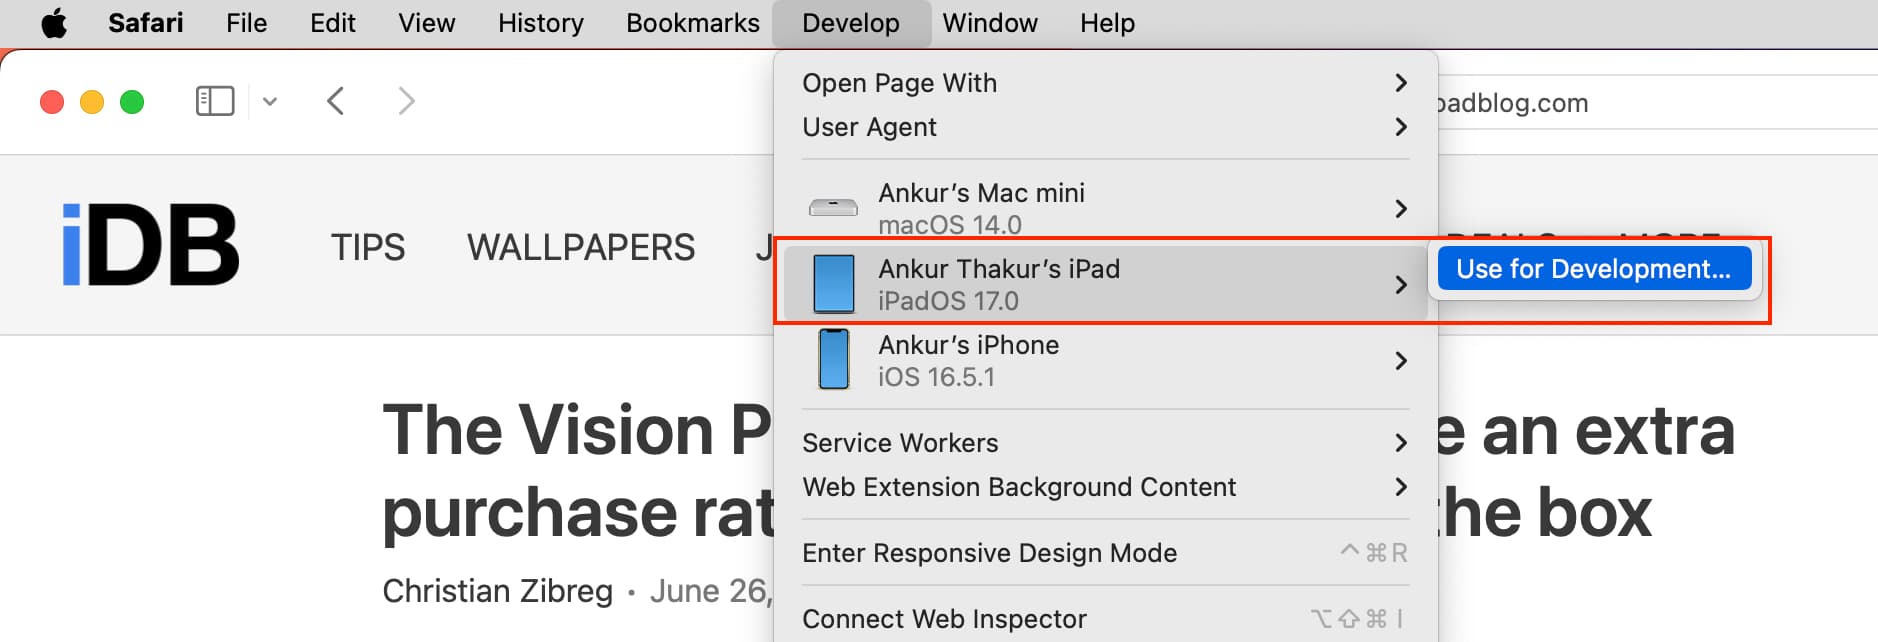
1) Click Develop from the Safari menu bar on Mac, and you’ll see your iPhone or iPad listed here.

2) Mouse over the device, and you’ll then see the websites open in Safari on your mobile device.
3) Select the one you want, and the Web Inspector will pop open in a new window for you to use.

Note: If this is the first time you’re using your iPhone or iPad for this work, take your mouse cursor over that iPhone or iPad and click Use for Development . Next, tap Trust on your iPhone or iPad and enter the device passcode. Now, this iOS or iPadOS device is ready to be used for web inspection. If it still shows a correction error, simply unplug the USB cable and plug it in again.
Position the Safari Web Inspector
If you’re using the Web Inspector for iOS, it will remain in its own floating window.
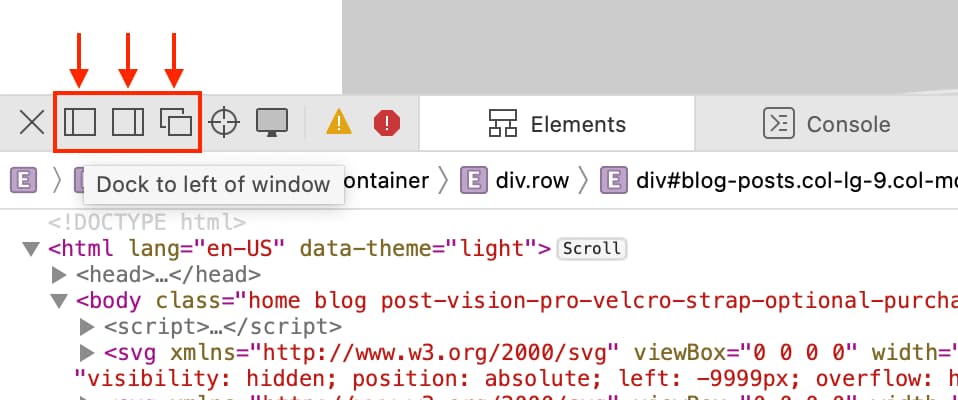
If you’re using it for Safari on your Mac, you can change its position. By default, Web Inspector displays at the bottom of your Safari window. To detach it and place it in a separate window or dock it to the left or right side of Safari, select one of the buttons from the top left of the Inspector window.
Get to know the Web Inspector
The Safari Web Inspector has a handy toolbar and tabs with some options that you can adjust to fit your needs.
Web Inspector toolbar
- “X” to close the Inspector
- Positioning buttons
- Reload button
- Download web archive button
- Activity viewer (resource count, resource size, load time, logs, errors, warnings)
- Element selector button
Web Inspector tabs
You can use all tabs or just a few. You can right-click or hold Control and click the tabs and then check and uncheck those you want to see. Rearrange the tabs by holding and dragging them to their new positions. And all the way to the right of the tabs bar, you’ll see a Settings button. This lets you adjust settings for tabs, indents, source maps, zoom, and more.

- Elements : Current state of the page’s Document Object Model
- Network : Resources loaded by the current page
- Debugger : View the JavaScript execution, variables, and control flow
- Resources : Resources being used by the current page’s content
- Timelines : A view of what the page’s content is doing
- Storage : State that is available to the page’s content
- Canvas : Contexts created from CSS
- Console : Shows logged messages and lets you evaluate JavaScript code
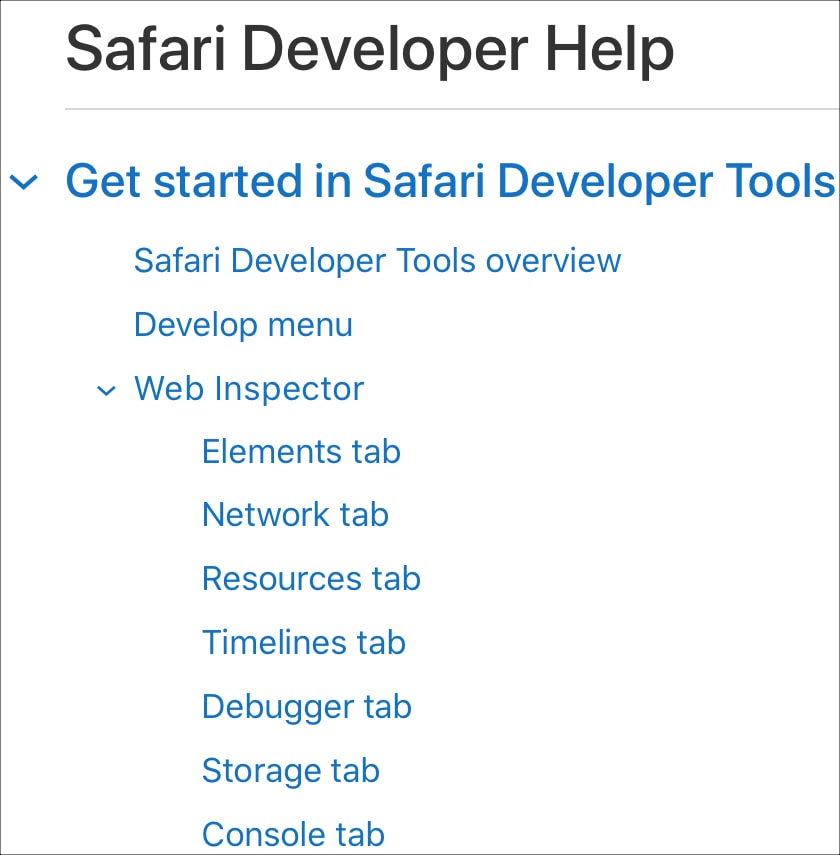
For in-depth help on a specific tab, you can head to the Apple Developer Support site . Select Table of Contents > Get started in Safari Developer Tools > Web Inspector .
Good luck with your inspection!
Hopefully, this guide will help you as you start working with the Safari Web Inspector for your iPhone, iPad, or Mac web development.
If you currently use the Web Inspector and have tips and tricks you’d like to share with others who are just starting, please feel free to comment below!
Check out next: How to view the source code of a webpage in Safari
David Lozzi
- Debugging Safari/Chrome on your iPhone/iPad/iOS device

In the world of modern web development, Web 2.0 (or is it 3.0?), with HTML5, CSS3, ES6, and frameworks and libraries up the wazoo, our web apps and sites always work seamlessly and flawlessly across all the browsers and devices… hahaha, I know…
The reality is, web development, as great and modern as it is, can have little caveats and nuances across the different browsers: Chrome, Safari, FireFox, Edge, and the Mac/Windows/Linux/iOS/Android versions of each. Thankfully, the big contenders like Netscape (those were the days) and Internet Explorer have finally been deprecated and are no longer expected to be supported in the wild. Even with the great modern web, we still have issues once in a while.
In my recent efforts in troubleshooting one small “nuance” between Chrome on Mac and Chrome and Safari on iOS (yes, all three were acting differently), I needed to debug my browser on my iPad and/or iPhone. I won’t get into what the issue is here, instead, I’ll get into how we can debug the browsers on our iOS devices. I’ve searched for many options, some worked, some didn’t, so below is what worked for me.
All steps below are all running on my:
- MacBook Pro 16-inc, M1 Pro, running macOS Ventura 13.6
- iPad Air (4th) v15.3.1
- iPhone 14 Pro Max iOS v17.0.3
What are we debugging
Before we get started in debugging, we should cover what we’re debugging. In the following debugging methods, we can debug anything our browser can get to: netflix.com, google.com, or our public website. With CI/CD in place, I can make code changes and get them into my dev environment in under 5 minutes, and that suffices at times. I can then hit the site directly on my iPhone and debug as needed.
Sometimes, if I’m really diving into a granular issue and don’t want to wait, I like to use ngrok. Ngrok spins up a gateway from a public address to your local dev machine. This allows me to troubleshoot realtime on my mobile browser while writing the code on my laptop. It’s pretty slick and has saved me a lot of time. I can even share the ngrok address with my colleagues and they can access it on my local machine too! Another option would be to set up DNS for your iPhone to navigate to your laptop while on the same wifi network, and that’s not worth the effort in my book.
Debugging in Chrome on iOS
This is great quick way to check out your console messages without using your Mac.
- In Chrome on your iPad or iPhone, go to chrome://inspect and then press Start Logging .
- Now go do your thing in another tab, keeping this tab open.
- Come back anytime to see any and all console outputs!
See, no laptop/desktop needed, just do it on the mobile device.
This is as far as we can get with Chrome on iPhone/iPad. From my limited understanding, Chrome for iOS uses a WKWebView which gets difficult to actually attach to and debug. If the JavaScript console output isn’t enough, try Safari…
Debugging in Safari on iOS
This is a great method of debugging your iOS devices as it gives you the closest thing to actually debugging on your computer. With this method you can use the dev tools on your Mac to connect to your iOS Safari browser. It’s pretty sweet.
- On your Mac , open Safari, then go to Safari > Settings.
- Click Advanced and click Show Develop menu in menu bar at the bottom of the window. Close the window.
- On your iPad or iPhone , go to Settings > Safari > Advanced.
- Scroll to the bottom and enable Web Inspector .
For this next part, I recommend using a USB cable to attach your iOS device to your Mac. You might get away with doing this over Wifi, as I have in the past, but it’s not reliable .
- Connect your device to your Mac using a USB cable, or try the following over Wifi.
- On your Mac, in Safari, click the Develop menu.
- Near the top of the menu you should see your iPad or iPhone listed.
- Hover over your device in the menu and you’ll see Safari with each tab listed below. Click the one you want to debug.
- The Web Inspector should then appear, now debug it: Elements, Console, Sources, Network, all of it should work!
Good enough for now
Between these two techniques, I’ve been able to troubleshoot my issues quite successfully. Generally, iOS Safari and Chrome act relatively the same, so debugging in Safari helps me clear my Chrome issue. And if it doesn’t I can always throw in more console.log s and see what Chrome is actually doing. Ideally, we should be able to debug the code directly on Chrome, like we can do with Safari, but at this time it’s just not possible.
One other option, for a cost: inspect.dev
There’s a product called inspect.dev that boasts it can debug Safari, Webviews, and Chrome from macOS, Windows, and Linux. Learn more at https://inspect.dev/why . I have not tried them out, I don’t want to pay for something that should be free for developers (hence this blog post).
Let me know if you know other ways to debug your mobile browsers! Leave a comment below or let’s connect on Twitter .
‘Til next time, happy debugging!
Please share the love!
- Click to share on Twitter (Opens in new window)
- Click to share on Facebook (Opens in new window)
- Click to share on LinkedIn (Opens in new window)
- Click to email a link to a friend (Opens in new window)
- Click to print (Opens in new window)
- Click to share on Reddit (Opens in new window)
- Click to share on Pocket (Opens in new window)
- Click to share on WhatsApp (Opens in new window)
7 thoughts on “ Debugging Safari/Chrome on your iPhone/iPad/iOS device ”
You should also check out using x-code’s simulator. Safari Dev Tools can attach to the Safari session on the simulator and you’re off to the races!
Oh yea, i just found that and then forgot that… thanks I’ll check it out closer and share my findings!
Thanks for article. One small correction Chrome for iOS uses WKWebView.
Thanks for the fix! will update
- Pingback: [FIXED] The image is taking the original dimentions of it on the phone after deployment - Learn How to FIX your angular code
Thanks bro! I’ll follow yours steps, wish me luck.
Leave a Reply Cancel reply
- Collaboration
- Microsoft Forms
- Microsoft Planner
- Microsoft Power Apps
- Microsoft Power Automate (Flow)
- Microsoft Teams
- Microsoft To-Do
- Office 365 Hybrid
- Office 365 SharePoint Online
- Productivity
- SharePoint 2013 Administration
- SharePoint 2013 Apps
- SharePoint 2013 Development
- SP2010 Administration
- SP2010 Authentication
- SP2010 Customization
- SP2010 Infrastructure
- SP2010 User
- SP2010 Workaround
- Uncategorized
- Users Don't Like SharePoint
Top Posts & Pages
- Sending a beautifully formatted email from Power Automate (Flow)
- Saving data from Microsoft Forms into Excel using Power Automate (Flow)
- Use Microsoft Forms to collect data right into your Excel file
- When Power Automate (Flow) can't find your Microsoft Form
- Best practices for working with data in Microsoft PowerApps
- npm install and the package-lock.json file
- Customize the SharePoint Calendar Colors
- Understanding Power Automate's Outlook Send Email Actions
- Squeezing a little more formatting out of Microsoft Forms
- Stack Overflow

- 2,084,813 hits
Discover more from David Lozzi
Subscribe now to keep reading and get access to the full archive.
Type your email…
Continue reading
- Documentation
Get Started
Introduction to inspect.
Installation guide
Using Inspect
- How to debug mobile websites on iOS devices with Inspect
- How to debug WebViews on iOS devices with Inspect
- Wireless debugging over WiFi
- iOS Simulator debugging
- How to debug mobile websites on Android devices with Inspect
- Managing teams and organizations
Troubleshooting
- Devices and targets
- Issues and bugs
Alternatives
- What makes Inspect a great alternative to ios-webkit-debug-proxy
- What makes Inspect a great alternative to remotedebug-ios-webkit-adapter?
Get an overview of Inspect’s features, and how to use them.
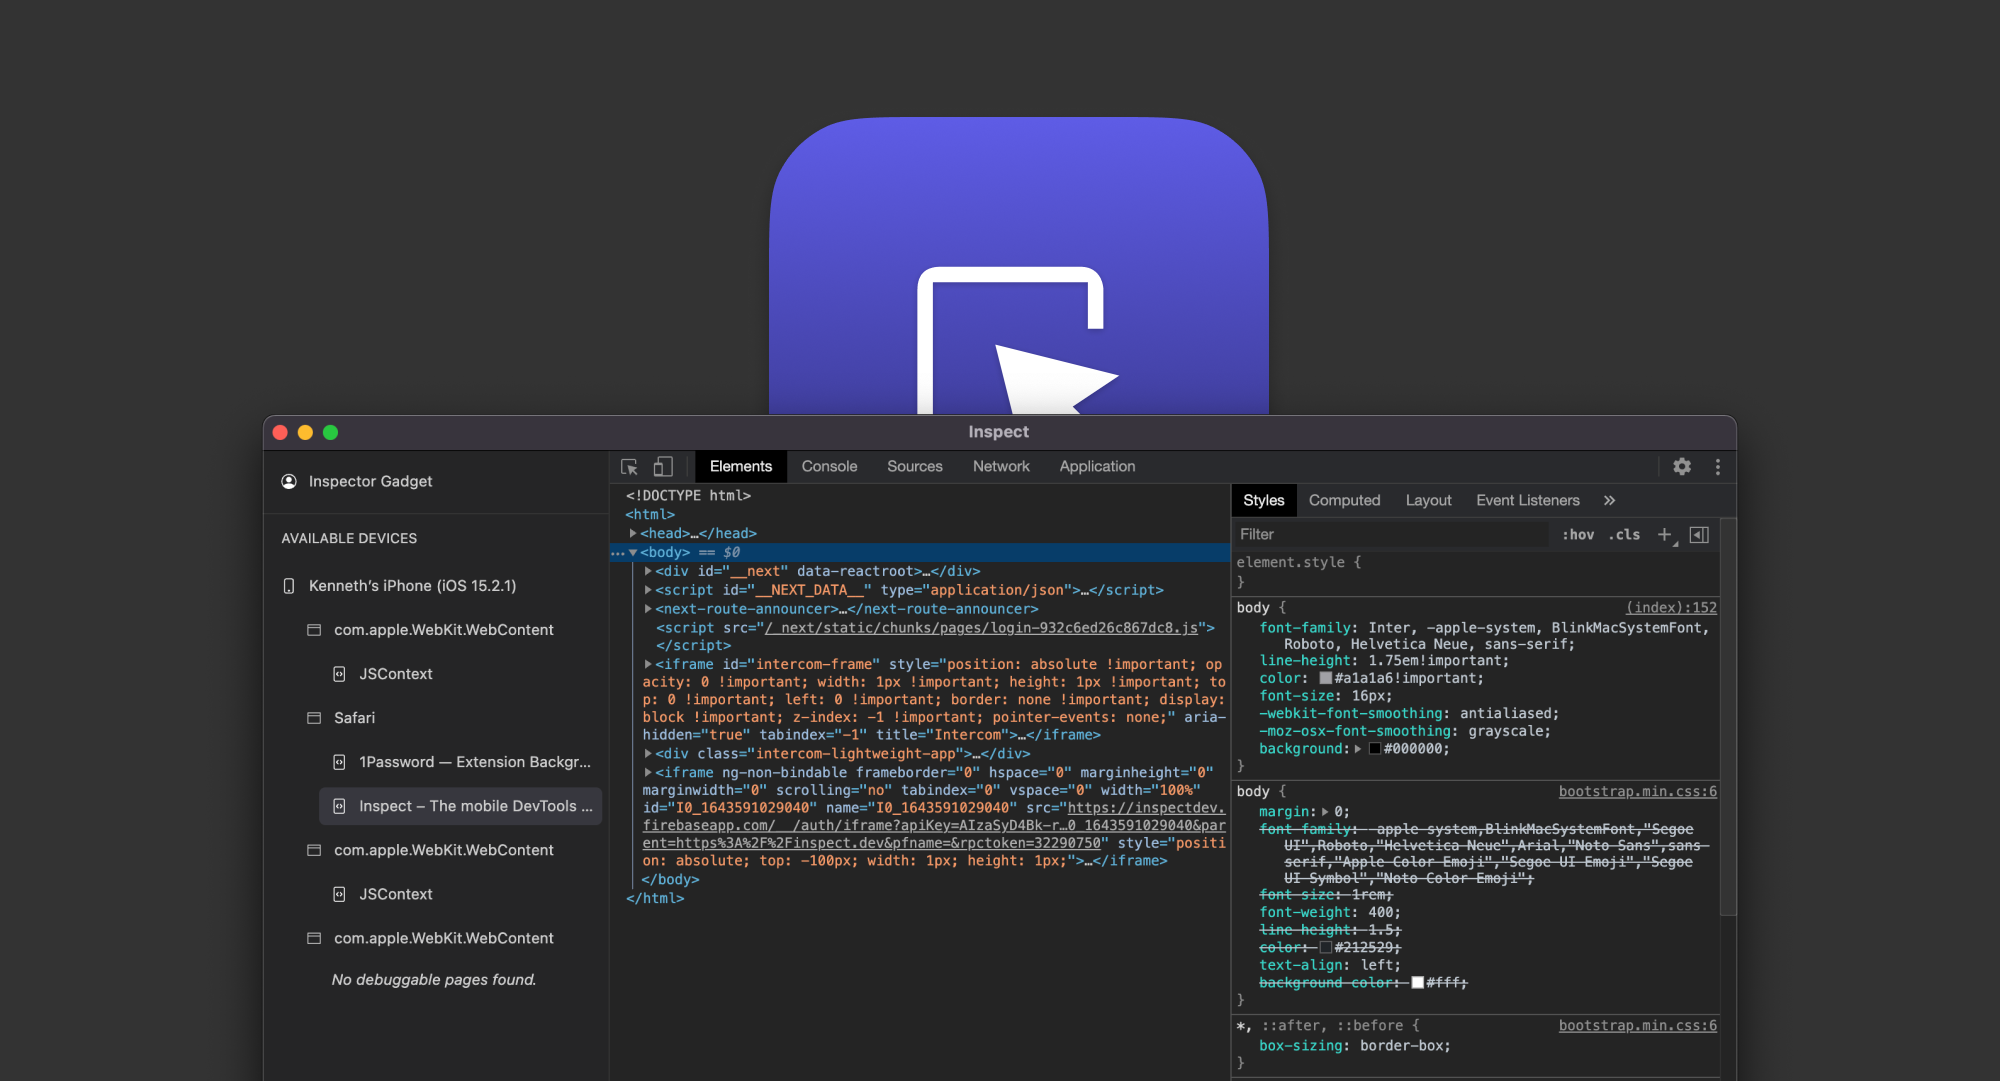
Debug Safari on iOS with Inspect
Debug Chrome on Android with Inspect
Help us make Inspect better
Did we miss something? Should we add a new section? Tell us at [email protected]
Was this page helpful?
- Help us make Inspect better

How to Enable and Use Safari Web Inspector on iPhone in iOS 17
If you are a developer or a website manager, we are sure you know the importance of inspecting websites to analyze website issues or debug web pages. On iOS, Safari used to have a built-in Debug Console for inspecting web page issues. However, since iOS 6, Safari on iPhones has been relying on the Web Inspector tool to show to debug and analyze websites.
So, if you are looking for a way to enable the Web Inspector tool on iOS or iPadOS and use it to debug websites on your Mac, we have prepared this simple guide for you. In this article, we are going to provide step-by-step ways to enable and use the Web Inspector tool on your iOS and macOS devices. This way you will be able to easily track down issues in iOS and iPadOS websites on your macOS devices.
Enable and Use Safari Web Inspector on iPhone
Now, below we have provided the ways to enable the Web Inspector tool for Safari on iOS and macOS devices. Hence, you must already know by now that the Web Inspector tool for Safari will work only if you have a Mac or a MacBook with which you can connect your iOS device.
With the method provided here, you will be able to use the Web Inspector tool to analyze all the resources of web pages, debug, and fix underlying issues of the pages. This method can also be used with the iOS Simulator, which comes free with XCode from the Mac App Store, to view and scale web pages for different screen sizes.

Enable Web Inspector on iPhone
Before you can view the websites from the iOS Safari on your Mac using Web Inspector, you will need to enable the tool on your iOS device. You can do that using the steps right below.
1. Open the Settings app on your iPhoned.
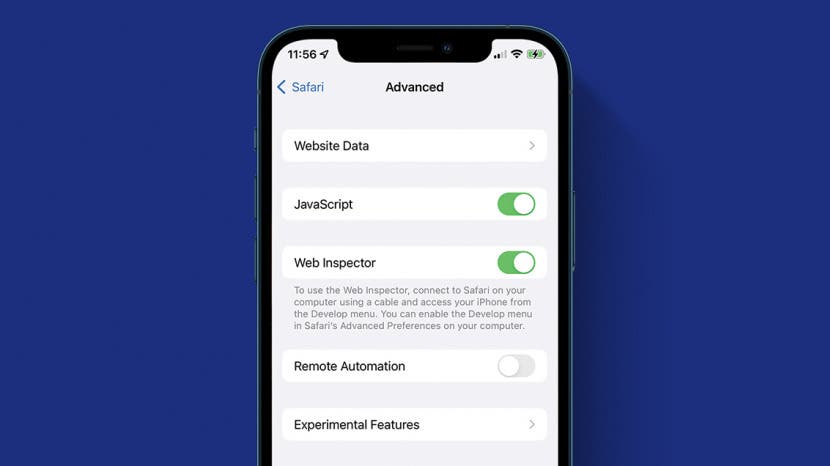
2. Go to Safari .
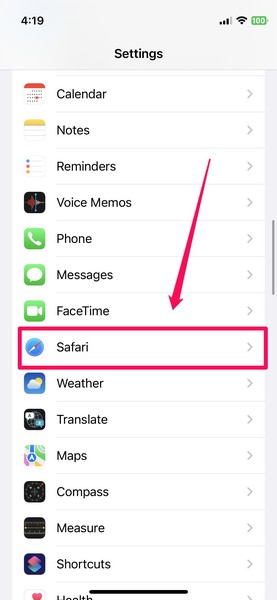
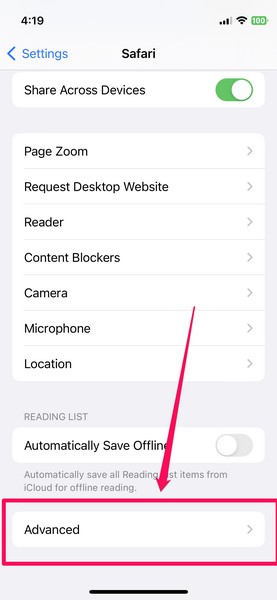
3. Scroll down to the bottom and tap the Advanced button.
4. On the Advanced settings page, enable the toggle for Web Inspector .
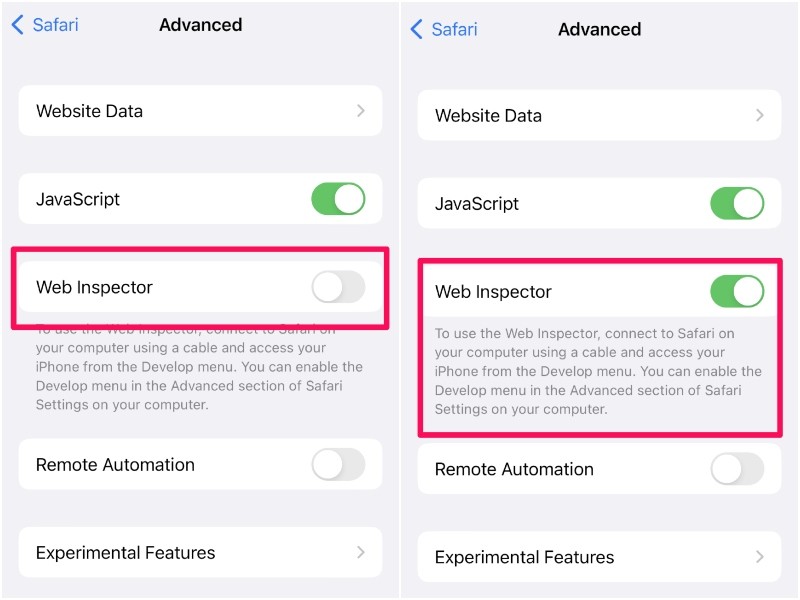
This is all you have to do to enable the Web Inspector tool on iOS. With this advanced setting enabled on your iPhone, you will be able to view and edit the websites opened on your iOS Safari right inside the Safari browser on your Mac.
However, before that, you will need to tweak a few settings in Safari on your Mac. Read on to find out how you can use the Web Inspector tool in Safari on your Mac.
Use Web Inspector for iOS Safari on Mac
Now, to use the Web Inspector tool for iOS/ iPadOS Safari on Mac, you need to connect your iPhone or iPad with the tool enabled to your Mac via a USB connection. Once both devices are connected, follow the steps below:
1. Open the Safari browser on your Mac.
2. Click the Safari option on the top navigation bar and select the Preferences option from the menu.
3. Now, go to the Advanced tab and check the box for the “Show Develop menu in menu bar” option.
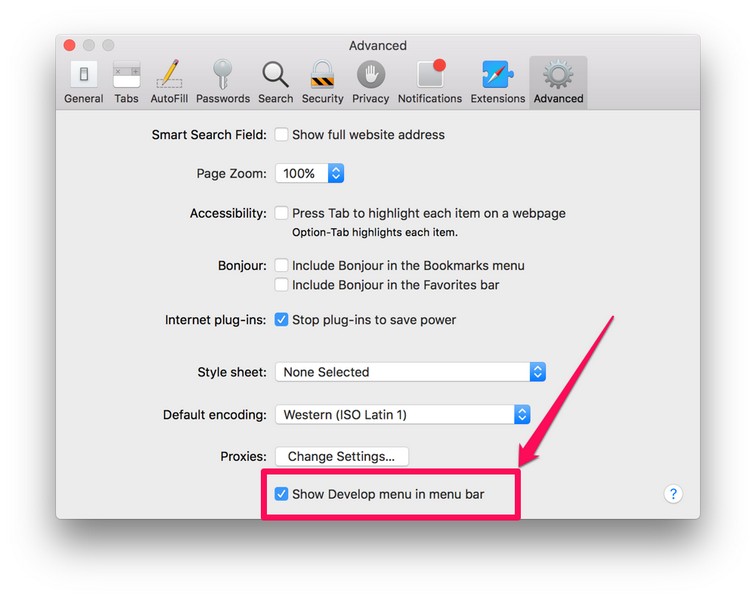
4. Exit the Settings window and you will see the new Develop menu on your Safari menu bar at the top.
5. Click the Develop option and you will see your iPhone or iPad listed.
6. Move your cursor on your device and you will see the websites opened on your iOS or iPadOS Safari appear on the drop-down list.
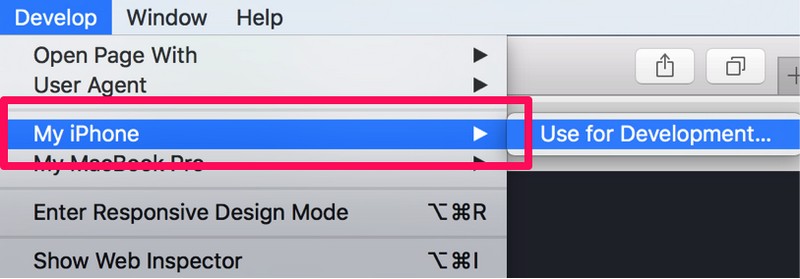
7. From here, you can click the website that you want to open in the Web Inspector console on your Mac for optimization and debugging.
So, this way, you can easily enable and use the Web Inspector tool for Safari on your iPhone or iPad and analyze websites on your Mac. The Web Inspector is especially useful if you are a macOS developer who also develops or manages iOS websites. With this, you can easily view the web pages from iPhones or iPads on your Mac and tinker with them to improve their quality and fix other issues.
How can I enable Web Inspector on my iPad?
The process of enabling the Web Inspector tool on iPhones and iPads is pretty much the same. Hence, you can use the method provided in this article to easily enable Web Inspector in Safari on your iPad and your iPhone.
Can I inspect web pages on my iPhone or iPad?
Although you can enable the Web Inspector tool in Safari on your iPhone or iPad, you will require a macOS device and a USB-Lightning cable to actually use the tool for inspecting web pages.
How can I bring up the Web Inspector console on Mac?
After enabling the Develop menu in the menu bar in Safari on your Mac (steps provided above), you can click the Develop option in Safari and select your connected iPhone or iPad to view the web pages. From here, you can click a web page and the Web Inspector console will open up the resources.
Final Words
So, this was all about enabling and using the Web Inspector tool in Safari on iPhones and iPads. It is a great tool for website developers to prototype, optimize, and debug web content on iOS, iPadOS, and macOS devices. And if this guide added value to your work or helped you in any way, do let us know in the comments below.
Dwaipayan Sengupta
After graduating with a Bachelor's in Business Administration, Dwaipayan has worked for reputable media firms such as Beebom and Pinkvilla. He has written over 1500 articles in his 3+ years of writing career and specializes in How-tos about Windows issues and features, flash news, and custom mechanical keyboards. When he is not writing or customizing mechanical keyboards, you can find him playing an intense Valorant match or browsing through his Reddit feed.
You may also like

How to Fix Google Authenticator Not Working on iPhone

How to Fix Geometry Dash Not Working on iPhone
How to Automatically Trigger iPhone Low Power Mode Earlier in iOS 17

How to Open APK Files on Windows 11
Leave a reply cancel reply.
Your email address will not be published. Required fields are marked *
Save my name, email, and website in this browser for the next time I comment.
How to Inspect Element on iPhone or iPad
Often, when attempting to save a small image, it will degrade in clarity and sharpness. Using inspect element to save an image will preserve its original size and clarity even if it looks very small on the website. This is a really cool feature, so don’t be scared to check out something a bit more advanced!
Related: How to Get a Refund on the App Store
How to Use Inspect Element on iPhone
How to save an image with safari on iphone using inspect element.
In order to use the developer tools and enable this option on your iPhone, you will need to have a Mac computer and a cable that will connect your phone to your computer. For more cool tips and tricks about how to use your Apple devices, be sure to sign up for our Tip of the Day . Let’s get started!

- Once you’ve gotten to this step, you will need to connect your phone to your Mac with a cable.
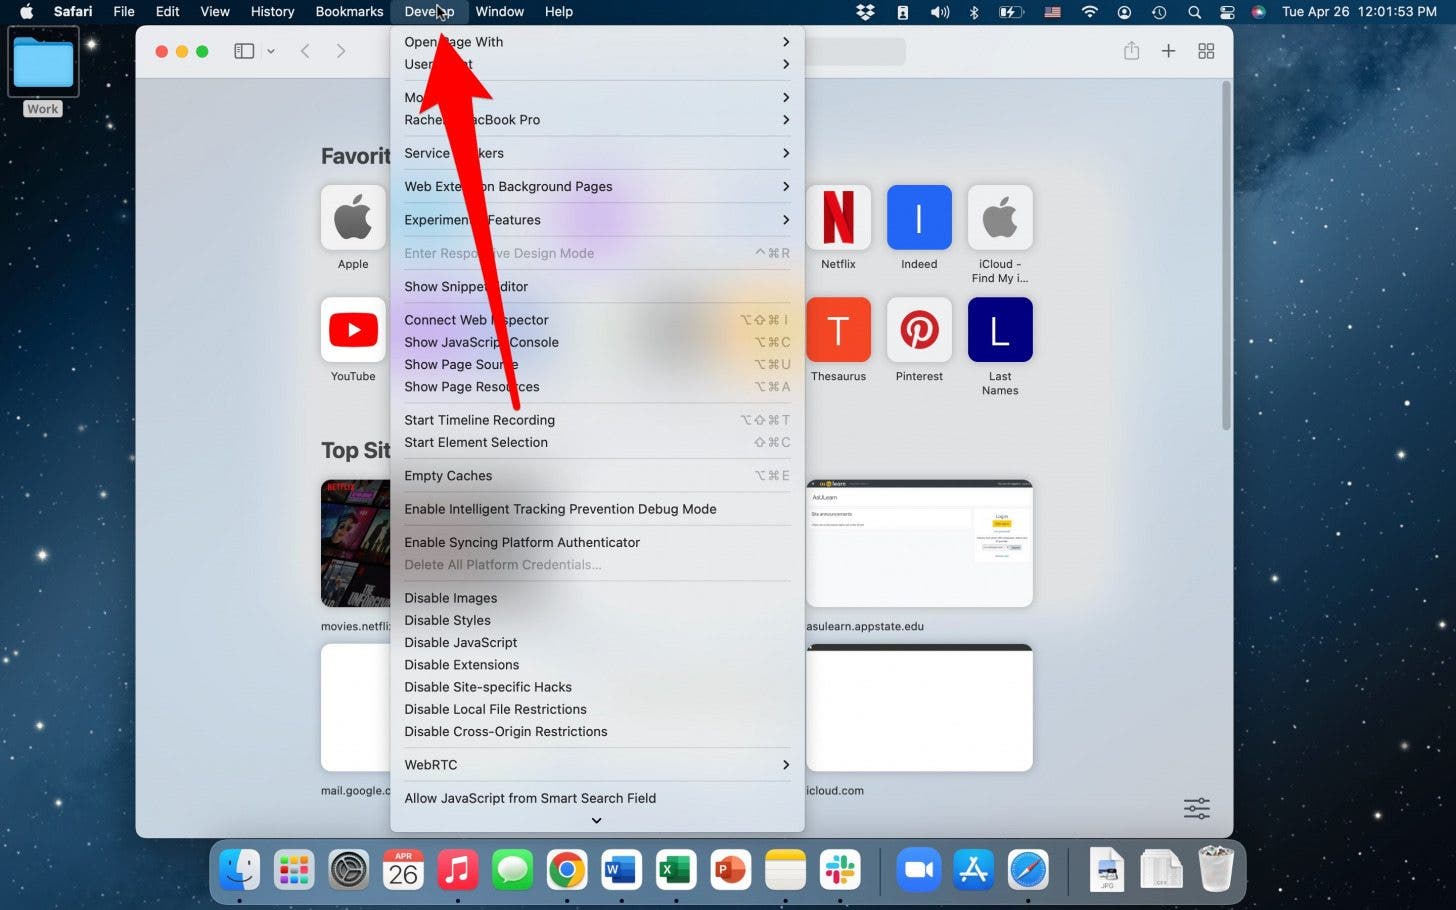
To save an image using Inspect Element
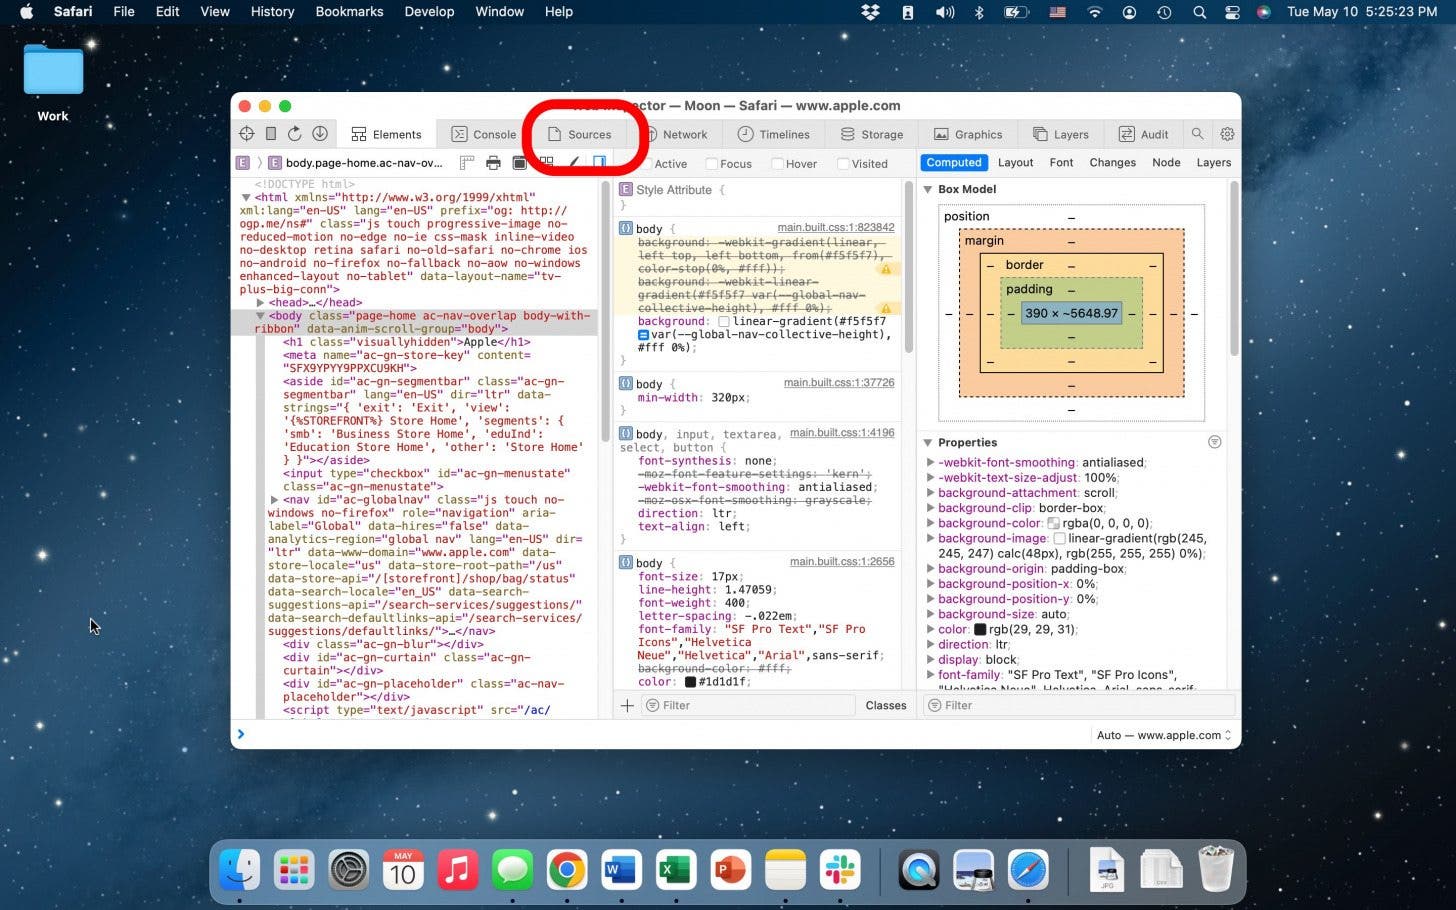
And that’s how you do it! Be sure to save the images under a name you'll remember. Developer tools and inspect element are quite advanced tools, but this information could prove very useful in the future. It’s also super cool to see the way that these devices connect and work with each other and how we may be able to take advantage of Apple’s integrated devices.
Author Details

Rachel Needell

Article Spotlight
Matias is launching a brand new keyboard based on a classic design.

The Matias Sculpted Ergonomic Keyboard improves on the legacy of the beloved Microsoft Sculpt Keyboard with upgrades that make it more functional and comfortable than ever before! The Matias Sculpted Ergonomic Keyboard stays true to the spirit of the discontinued Microsoft original.
Featured Products

In episode 211, David and Donna cover Apple's "Let Loose" event that went live on May 7th, 2024. This event was all about the new supercharged iPads. From the AI-focused M4 chip to inky-black OLED, tune in to find out if it really is the biggest iPad update since its original release! Listen now and find out !
Most Popular
How to Tell If Someone Blocked Your Number on iPhone
How to Record a Phone Call on an iPhone for Free
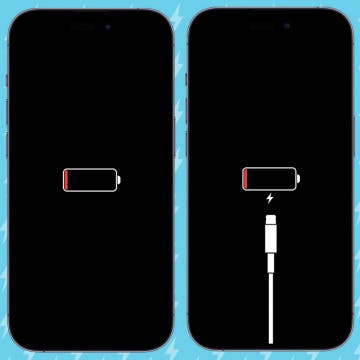
How to Tell If a Dead iPhone Is Charging
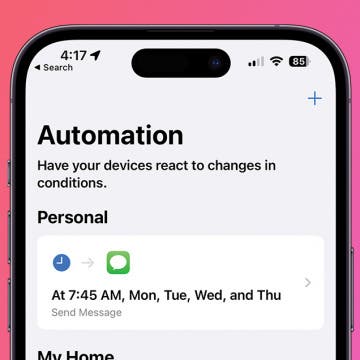
How to Schedule a Text Message on iPhone
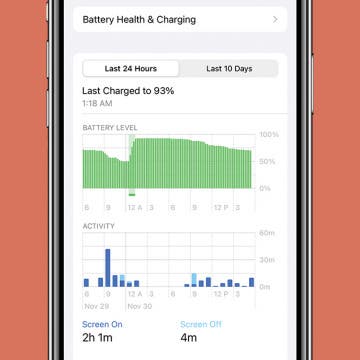
10 Simple Tips To Fix iPhone Battery Drain

How To Put Two Pictures Together on iPhone
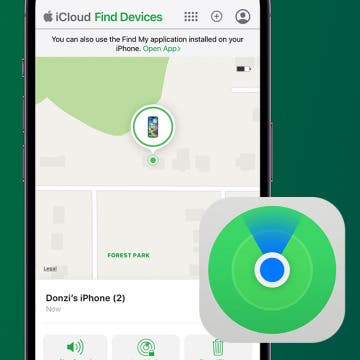
How To Find My iPhone From Another iPhone
Can iPhones Get Viruses? How to Detect & Remove Malware (iOS 17)
iPhone Notes Disappeared? Recover the App & Lost Notes
How To Get an App Back on Your Home Screen

How to Refresh AirTag Location Manually & More Often
iPhone Control Center Icons
Featured articles, why is my iphone battery draining so fast 13 easy fixes.
Identify Mystery Numbers: How to Find No Caller ID on iPhone
Apple ID Not Active? Here’s the Fix!
How to Cast Apple TV to Chromecast for Easy Viewing

Fix Photos Not Uploading to iCloud Once & for All (iOS 17)
There Was an Error Connecting to the Apple ID Server: Fixed

CarPlay Not Working? 4 Ways to Fix Apple CarPlay Today
Check out our sponsors.

- Each email reveals new things you can do with your phone (and other devices) with easy-to-follow screenshots.
- Enter your email to get your first tip immediately!

How to view and clear your web browsing history in Safari on iPhone or iPad
K nowing how to view and clear your web browsing history in Safari on an iPhone or iPad is fundamental for privacy. After all, browsing history comes bundled with web navigation unless you're on Private browsing.
Safari is Apple’s proprietary web browser, and it offers a simple method to review and delete specific websites from your web history, or all of it. In this guide, we'll walk you through the steps to access and clear your Safari browsing history on iPhone and iPad.
Additionally, for an incredibly secure browsing experience on iPad, we recommend checking out the best iPad VPN .
Tools and requirements
- An iPhone or iPad
Steps for how to view and clear your web browsing history in Safari on iPhone or iPad
- Launch Safari.
- On an iPhone, tap the Book icon at the bottom. On an iPad, tap the 'Show Sidebar' button at the top left.
- Select the History tab (Clock icon).
- Tap 'Clear' and select the timeframe.
- Tap 'Clear History'.
Step-by-step guide to view and clear your web browsing history in Safari on iPhone or iPad
We’ve demonstrated the steps below on an iPhone. But the process is nearly the same on the iPad, and we’ve pointed out the differences where relevant.
1. Launch Safari and access History
Open Safari on your iPhone and tap the 'Bookmarks' button at the bottom (beside the tab switcher button).
On iPad, tap the 'Show Sidebar' button at the top left corner.
2. Clear History
Select the History tab (clock icon) to view all your browsing history.
Tap 'Clear' at the bottom right corner to bring up the menu and choose a duration under the 'Clear Timeframe : Last hour , Today , Today and yesterday' , and 'All history' .
To close tabs along with clearing history, toggle on 'Close All Tabs' .
Finally, tap 'Clear History' at the bottom to erase your browsing history.
To delete only specific websites from history, go to the History tab , tap 'Edit' (in the bottom left corner), select the websites you wish to delete, and then tap 'Delete' (bottom right corner).
Final thoughts
Clearing your web browsing history in Safari is a straightforward and effective way to boost privacy. But remember that deleting your history removes data that you could easily use to access previously visited websites. If you’d prefer not to save your browsing data, try the Private Browsing Mode on Safari.
For more iPad and iPhone tips, check out our tutorials on how to use and configure a VPN on your iPhone or iPad , how to change your iPhone password or reset it , and how to save, view and manage passwords in Safari .


IMAGES
VIDEO
COMMENTS
Webpages you open in Safari in iOS and iPadOS appear in a submenu for the connected device of the Develop menu of Safari on a connected Mac. Safari groups webpages and other content by app, making it easier to find the webpage you want to inspect. Find the webpage you want to inspect, then select it to open a new Web Inspector window.
Activate Web Inspector on iOS: Go to Settings > Safari > Advanced and move the Web Inspector toggle switch to the On position. Use Web Inspector on macOS: Connect your iOS device to a Mac and choose the URL to inspect from the Develop menu. If you run into a bug or another issue with a website on Safari mobile, use the Web Inspector tool to ...
Overview. Web Inspector helps you inspect all the resources and activity on webpages, Service Workers, Mac and Home Screen web apps, and JavaScript running inside your applications, making development more efficient across Apple platforms. The clean, unified design puts each core function in a separate tab, which you can rearrange to fit your ...
Steps. Download Inspect by going to our download page. Connect your iOS device to your PC via USB cable or Wi-Fi. Start Inspect and follow the instructions on how to setup your computer. You are now ready to Inspect! Open Safari on your iOS device and start debugging.
Use Safari on your iPhone to navigate to the site on which you want to use Inspect Element. 5. On your Mac, click the Develop menu. You will see your iPhone listed here. 6. Hover your mouse over your iPhone and select the website. This opens the Inspect Element panel on your Mac for the site that's open on your iPhone.
Connect the iOS device to the machine. Enable the Web-Inspector option. To do so: Go to Settings > Safari > Scroll down to the bottom > Open Advanced Menu>. Turn on Web Inspector. Open the desired web page to debug or preview on your mobile Safari browser. Once done, enable the Develop menu on the Mac device.
Enable the Web Inspector on your iOS mobile device by: Going to Settings > Safari > Scroll down to the bottom > Open Advanced Menu> Turn on the Web Inspector. Note: This feature only works on the actual Apple Mac and not on Safari running on Windows. One just needs to enable the "Show Develop menu in the menu bar". The steps to do so are as ...
Inspect allows you to debug Safari on iOS devices from macOS, Linux, and Windows. Here are the simple steps to follow whether you're testing or debugging an iOS Safari web page or app with Inspect: Connect your iOS device to your PC via USB cable or Wi-Fi. You can use any device with a macOS, Linux, or Windows operating system.
Enable Web Inspector on iOS : Open the Settings app on your iPhone or iPad. Scroll down and tap Safari. Scroll to the bottom of the page and tap Advanced. Tap the toggle next to Web Inspector to the On position. Enable Safari Developer Mode on Mac : Open Safari on your Mac. Click Safari in the top left corner of your Menu Bar.
Here are the simple steps to follow whether you're testing or debugging an iOS Safari web page or app with Inspect: Connect your iOS device to your PC via USB cable or Wi-Fi. You can use any device with a macOS, Linux, or Windows operating system. Start Inspect and follow the instructions on how to setup your computer. You are good to go!
Web development tools. Apple has brought its expertise in development tools to the web. Safari includes Web Inspector, a powerful tool that makes it easy to modify, debug, and optimize websites for peak performance and compatibility on both platforms. And with Responsive Design Mode, you can preview your web pages in various screen sizes ...
1) Click Develop from the Safari menu bar on Mac, and you'll see your iPhone or iPad listed here. 2) Mouse over the device, and you'll then see the websites open in Safari on your mobile device. 3) Select the one you want, and the Web Inspector will pop open in a new window for you to use. Note: If this is the first time you're using your ...
Inspect helps you debug the mobile web on iOS and Android by giving you an all-in-one developer tool for macOS, Windows, and Linux. Products. Inspect. The standalone DevTools. Inspect CLI New. Debug the web from CI & other tools. Guides. Safari and WebViews on iOS. Inspect and debug Safari. Chrome and WebViews on Android. Inspect and debug ...
Method 2: Using Web Inspector for Debugging on Safari. Furthermore, developers can leverage the Web Inspector to inspect any particular element and debug a specific issue for a specific screen size. ... (Safari Browser Testing on iPhone 14 Pro running on the latest iOS 16.3) Not only can testers access Safari DevTools on a single dashboard, but ...
On your Mac, in Safari, click the Develop menu. Near the top of the menu you should see your iPad or iPhone listed. Hover over your device in the menu and you'll see Safari with each tab listed below. Click the one you want to debug. The Web Inspector should then appear, now debug it: Elements, Console, Sources, Network, all of it should work!
Debug Safari on iOS with Inspect. Debug Chrome on Android with Inspect. Debug Chrome on Android with Inspect ...
Working with older versions of macOS and iOS. For apps linked against an SDK before macOS 13.3 and iOS 16.4, WKWeb Views and JSContexts will continue to follow the previous behavior of always being inspectable when built for debugging from Xcode. Apps that support older versions of macOS and iOS while linked against the most recent SDK will not get the previous behavior of all content being ...
The name of your device appears in the Develop menu of Safari. Alternately, you can use iOS Simulator to take advantage of Web Inspector's debugging capabilities, which comes free with Xcode from the Mac App Store. Use the same instructions, To enable Web Inspector on iOS, from within the iOS Simulator's Settings app.
Now, to use the Web Inspector tool for iOS/ iPadOS Safari on Mac, you need to connect your iPhone or iPad with the tool enabled to your Mac via a USB connection. Once both devices are connected, follow the steps below: 1. Open the Safari browser on your Mac. 2. Click the Safari option on the top navigation bar and select the Preferences option ...
To inspect elements on iPhone with Safari developer tools, follow these steps: On an iPhone, open the Settings and tap Safari. Scroll down and tap Advanced . On the next screen, toggle on Web Inspector . On your Mac device, open the Safari browser. Click Safari in the menu bar and select Preferences.
Next, open the Safari app on your iPhone and go to the webpage you want to inspect. With your iPhone unlocked and the selected webpage open, go back to your Mac and open Safari. Click on Develop from the menu bar and select your iPhone. When you hover over your iPhone's name, you should see a list of web pages that are open on your iPhone.
Inspect is a standalone implementation of debugging infrastructure used by Safari (WebKit) on your iOS device. Inspect talks to the USB-driver provided by iTunes, and takes care of rest by translating all the APIs and protocols to enable Chrome DevTools to be used with iOS. You don't need to spend $799 for a Mac Mini to be able to debug the web ...
Open Safari on your iPhone and tap the 'Bookmarks' button at the bottom (beside the tab switcher button). On iPad, tap the 'Show Sidebar' button at the top left corner. 2. Clear History.
In Safari, there are two ways to begin inspecting a webpage. The first is via the Develop menu. With the webpage you wish to inspect frontmost in Safari, go to the Develop menu and choose Show Web Inspector (⌥⌘I). Web Inspector will then appear, and will be inspecting the webpage. The second was to show Web Inspector is to right click on ...